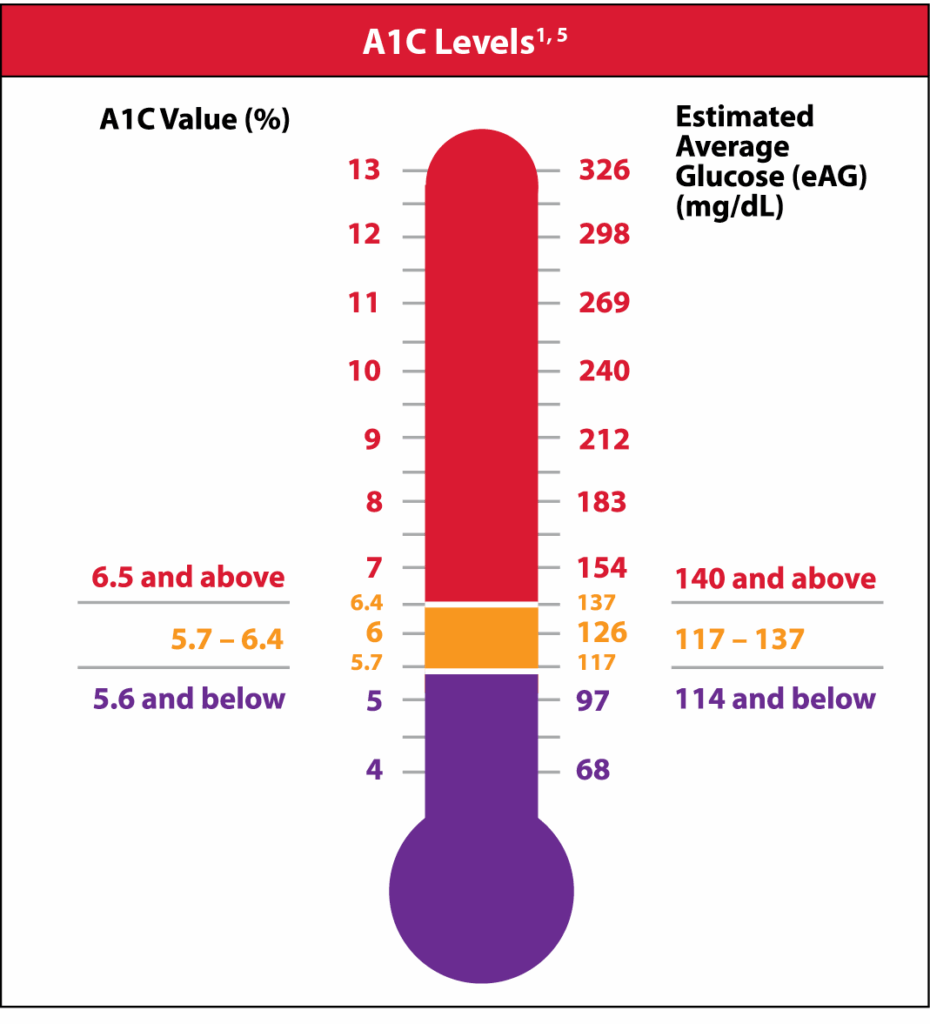
For individuals with diabetes, monitoring A1c levels is crucial in managing their condition. A1c, or hemoglobin A1c, is a measure of average blood glucose levels over the past 2-3 months. It is expressed as a percentage and provides a good indication of how well blood sugar levels have been controlled over time.
Typically, A1c levels below 5.7% are considered normal, while levels between 5.7% and 6.4% indicate prediabetes. A1c levels of 6.5% or higher are indicative of diabetes.
A1c Conversion Chart To Glucose
Converting A1c to Glucose Levels
While A1c levels provide an overall picture of blood sugar control, some individuals may prefer to understand how these levels translate to actual glucose readings. An A1c conversion chart can help with this conversion process, providing a rough estimate of blood glucose levels based on A1c readings.
For example, an A1c level of 6% corresponds to an average blood glucose level of approximately 126 mg/dL. Similarly, an A1c level of 7% corresponds to an average blood glucose level of around 154 mg/dL. This conversion chart can be a useful tool in understanding the relationship between A1c and glucose levels.
Using the Conversion Chart
When using an A1c conversion chart to estimate blood glucose levels, it’s important to remember that individual variations can occur. Factors such as diet, exercise, and medication can all impact blood sugar levels and may not always align perfectly with the estimated values from the conversion chart.
Consulting with a healthcare provider is recommended for accurate interpretation of A1c levels and blood glucose readings. They can provide personalized guidance and recommendations based on individual health status and treatment goals.
